Notice:
This post is older than 5 years – the content might be outdated.
If you ask a developer about their favorite programming language, the answer will most likely be the one they are most familiar with. The same applies to decisions about which public cloud provider to choose. In this post we’ll take a look at a different approach, which allows us to compare the three big public cloud providers (Amazon, Google and Microsoft) in a reproducible way. To be more precise, we’ll take a look at the Infrastructure as a Service (IaaS) offerings with some glances to additional services in the field of cloud computing.
Getting a new perspective – AHP
Making good decision can be quite challenging and will be even harder if you rely on personal preference solely. Take a look at the following examples:
- Binary decisions: Provider X offers feature A, while Provider Y doesn’t
- Scale-based decisions: Provider X’s availability is 99% while provider Y offers 99,99%
- …
While multiple binary decisions can be easily compared with other binary decisions, there is no real connection between e.g. binary and scale-based decisions. To solve this problem, we’ll use a tool called the Analytic Hierarchy Process (AHP). AHP is a mathematical method, developed by Thomas L. Saaty in the 1970s that allows to compare facts that are, under normal circumstances, not comparable. Complex decisions are broken down to smaller ones and all brought to a numeric scale that can be easily compared.
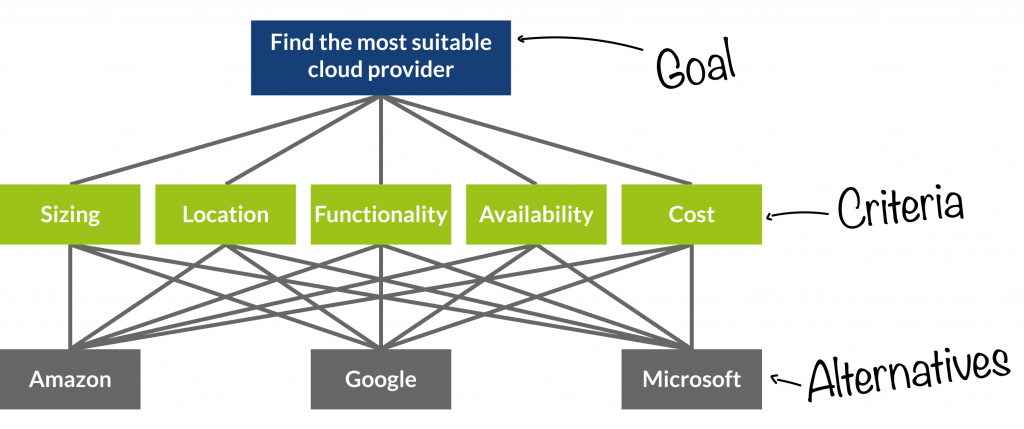
AHP arranges its elements in a hierarchy. These elements can be one of the following type: Goal, criteria and alternatives. The figure below shows an overview of the hierarchy: Our goal is to find a suitable public cloud provider. The criteria specify which aspects are important in reaching the goal. To reach the goal, we have three alternatives.

Criteria for Cloud Computing
The criteria for this article are taken from the Service Measurement Index (SMI). It consists of seven categories containing 50 Key Performance Indicators (KPI) from the field of cloud computing. From those KPI we choose the following:
- Availability: The availability of one virtual machine (VM)
- Cost: Monthly cost for a six VM configuration
- Functionality: Which additional services (Database, Load-Balancer, etc.) are available?
- Sizing: Which types of instances are available?
- Location: How many european datacenters and which services are available there?
Hands on: AHP
Although the underlying calculations can be made by hand, it is advisable to use specialised software. There are many tools out there to support AHP based calculations. They range from simple Excel templates, to online calculators to commercial software. For the example in this article, we’ll use the Priority Estimation Tool (PrIeST) to capture our data and ratings. The example data used in this article can be downloaded and imported in PrIeST.
The first step in AHP now is to compare pairs of criteria and specify their importance to each other. This comes down to ratings like: The criterion cost is three times more important than availability. Decisions like this need to be made for all pairs of criteria. The rating is done on a numeric scale from 1 to 9, on which 1 means both criteria are of equal importance and 9 means one dominates the other. After the rating is done, PrIeST will present the resulting priorities. This shows, which influence each criterion has in reaching our goal.

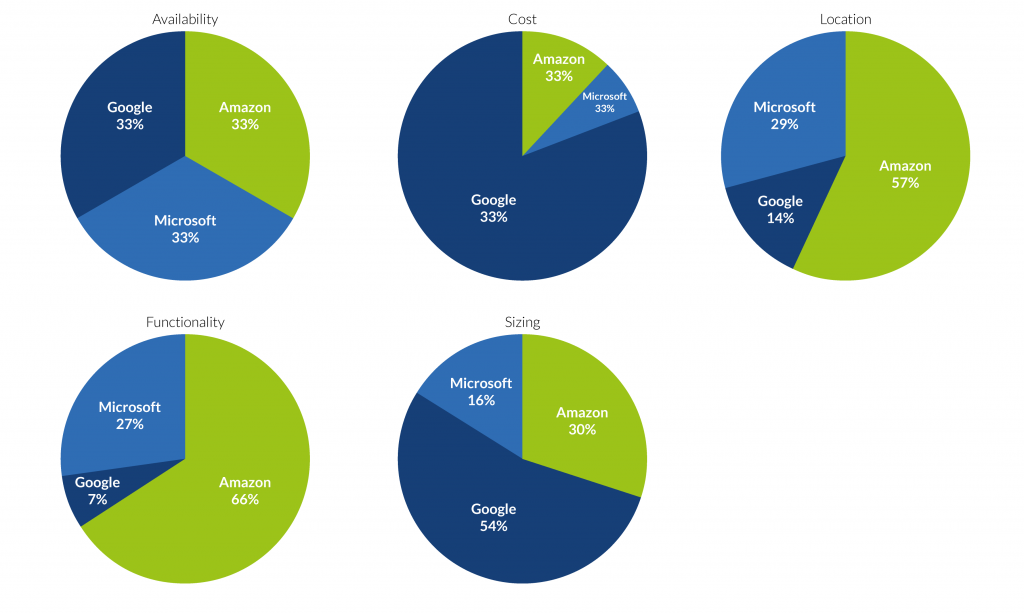
The same pairwise comparison needs to be done for each criterion and all alternatives. In this case we need to determine the capabilities of each provider in a certain area and also rate it on a scale from 1 to 9. The concrete ratings can be found in the attached file and are based on the following facts:
Availability is an easy one, because all three providers offer the same quantity: 99,99%. This means, that a VM can be unavailable for 4,38 hours per year. Although the service quality is the same between all three, they offer different discounts when violating the SLA.
To better compare the costs, a basic scenario was matched against the three providers:
- 3 Web Server VMs (4 Cores, 16GB RAM, 100GB storage)
- 3 Database VMs ( 2 Cores, 16GB RAM, 1TB storage)
- 100GB In/Out traffic
To sum up, Google was by far the cheapest of the three competitors. Their prices were only half of Amazon’s and Microsoft’s which leads to the weights below.
Functionality is a tricky one, because here the providers differ very much. To keep it simple, services are first classified by themes (network, databases, Big Data, etc.) and then compared between the providers. Results are then aggregated in three categories:
- Services offered by all providers
- Services offered by some providers
- Services offered by one provider (unique)
All providers offer basic services like virtual machines, containers, network services (DNS, VPN, Load-Balancers, …) or databases, while IoT (Internet of Things) services are only provided by Amazon and Microsoft. To sum up, Amazon offered six unique services while Google and Microsoft each only offered one.
The criterion Sizing is based on the number and range of supported instance types. Amazon offers many instance types (29) where customers can choose between 1–32 CPUs and 0.5–244 GB RAM. Google only offers 18 different types with 1–32 CPUs and 0.6–208GB RAM. A unique feature of Google is the ability to specify a custom instance in the given range of resources. Microsoft offers 25 different instance types where you can choose between 1–16 CPUs and 0.75–112GB RAM.
Amazon offers two european datacenters in Ireland and Frankfurt (a third is planned) and offers 50/56 services in Ireland and 36/56 services in Frankfurt. Google runs one datacenter in Belgium and 15 of 17 services can be hosted there. Microsoft currently runs two datacenters (Ireland, Netherlands) and offers 60/90 and 71/90 services there.

To get startet with PrIeST, we’ll import the example data and calculate the result. To start it, use the following command or just doubleclick PriEsTGUI.jar
|
1 |
> java -jar PriEsTGUI.jar |
Now press Import and select the example.pwc file. Under Problem and Details you can find the alternatives and criteria as well as the numeric ratings of the pairwise comparison. To calculate the result select Eigenvector in the Methods panel and click Rebuild All. The results can now be found in the top right corner and are presented in the figure below.

We can see that Amazon and Google fulfill our goal equally, while Microsoft is far behind.
Conclusion
As with most decisions, the best suitable public cloud provider heavily depends on the specific requirements. If you just need a cheap provider, Google is most likely the one to go for. On the other hand, if you need a rich set of additional services, Amazon and Microsoft are more attractive. With AHP at hand, decisions can be made rather simply for different use cases. Criteria and priorities can be collected from customers or made specific for certain projects and deliver a precise answer to the given question. Criteria and alternatives can be swapped out and replaced as needed.
Read on
Interested in Cloud Computing? Have a look at our portfolio on Big Data and Business Intelligence! Any questions? Drop us an email at info@inovex.de or call +49 721 619 021-0.
Join us!
We’re currently hiring: Business Intelligence Entwickler (m/w/d) or Werkstudent (m/w/d) im Bereich Data Management & Analytics or Software Entwickler (m/w/d) mit Schwerpunkt Big-Data-Technologien.


