In this blog post, I would like to examine a proof of concept (PoC) implementation for a simple Edge Computing use case, which I did in the context of my master thesis at inovex. It leverages the Azure IoT Edge solution and the surrounding IoT ecosystem.
Introduction
Edge Computing is a hot topic in today’s information technology industry and also in academic research. It is described as a computing paradigm moving and facilitating computational tasks at the edge of the network and is therefore considered to be among the most suitable solutions for IoT-based application scenarios.
Thus, it was also the main topic I focused on in the course of my master thesis at inovex. The thesis itself was of cumulative nature, meaning that it was structured along three independent essays, each tackling a different topic in the field of Edge Computing. In doing so, one of these papers examined a PoC implementation of a simple Edge Computing use case using Azure IoT Edge as the main implementation component. This blog post will cover this concept.
Scope of the target Use Case
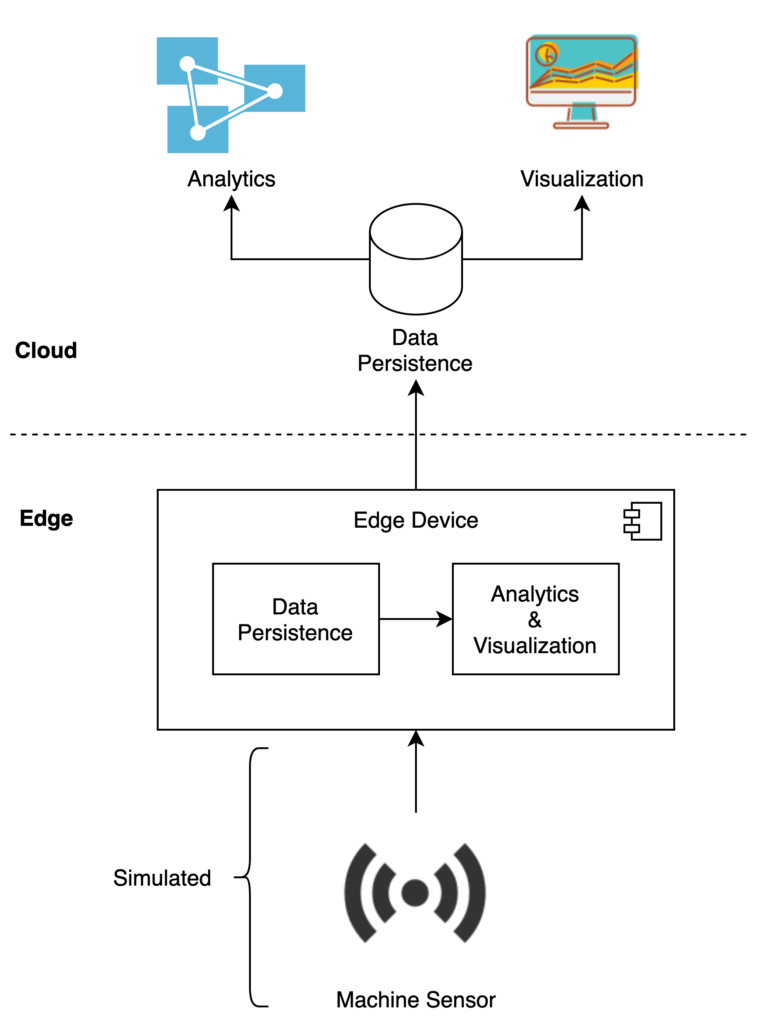
The target use case was scoped as follows: machine sensor data shall be simulated and then sent to the Azure IoT Edge powered edge devices. On these devices, the data shall be persisted and made available for analytics and visualization capabilities. Furthermore, the generated data shall be sent to the cloud for long-term persistence and also further analytic tasks. Additionally, simulating the development lifecycle of custom software modules for the edge devices as well as a monitoring and logging setup were subject of the PoC.

Short Introduction to Azure IoT Edge
Azure IoT Edge is Microsoft’s managed service for deploying and running workloads on edge devices and is part of Azure’s IoT ecosystem. It is made up of three major parts. First, the IoT Edge modules, which are Docker compatible containers, running several different kinds of workloads ranging from Azure service to third party services and also custom-developed containerized applications. These modules are directly deployed to IoT Edge devices. The second major component is the IoT Edge runtime residing directly on the edge devices and responsible for management and communication tasks. Its capabilities range from workload and module lifecycle management to security tasks and status monitoring to the cloud. It also manages all communication channels between leaf and IoT Edge devices, modules, and the cloud. The last part of Azure IoT Edge is the cloud interface providing an upstream connection to Azure IoT cloud services and enabling remote monitoring and IoT Edge device management at scale.

Criteria for Evaluating the PoC
In order to validate the performance of the PoC after the implementation, I defined several criteria groups which were discovered through expert interviews among inovex and a comprehensive literature review, also done in the course of my master thesis. The PoC is trying to address all of these criteria by either implementing them directly or through the system composition.
| Criteria Group | Sub-Criteria |
| Protocols | MQTT |
| AMQP | |
| HTTP | |
| Network Capabilities | Offline Functionality |
| On-Device Communication | |
| Development Lifecycle | Language SDKs |
| CLI | |
| CI / CD Integrations | |
| Infrastructure as Code | |
| Documentation | |
| Platform Operations | Monitoring Integrations |
| Logging Integrations | |
| Security | Network Policy Support |
| Privileges & Capabilities | |
| Encryption at rest | |
| Transport Encryption |
As the criteria are split into aspects concerning the system architecture and service capabilities itself and also aspects concerning the development workflow of implementing and deploying custom software on the devices, the PoC covers a system implementation as well as a full development workflow.
System Architecture
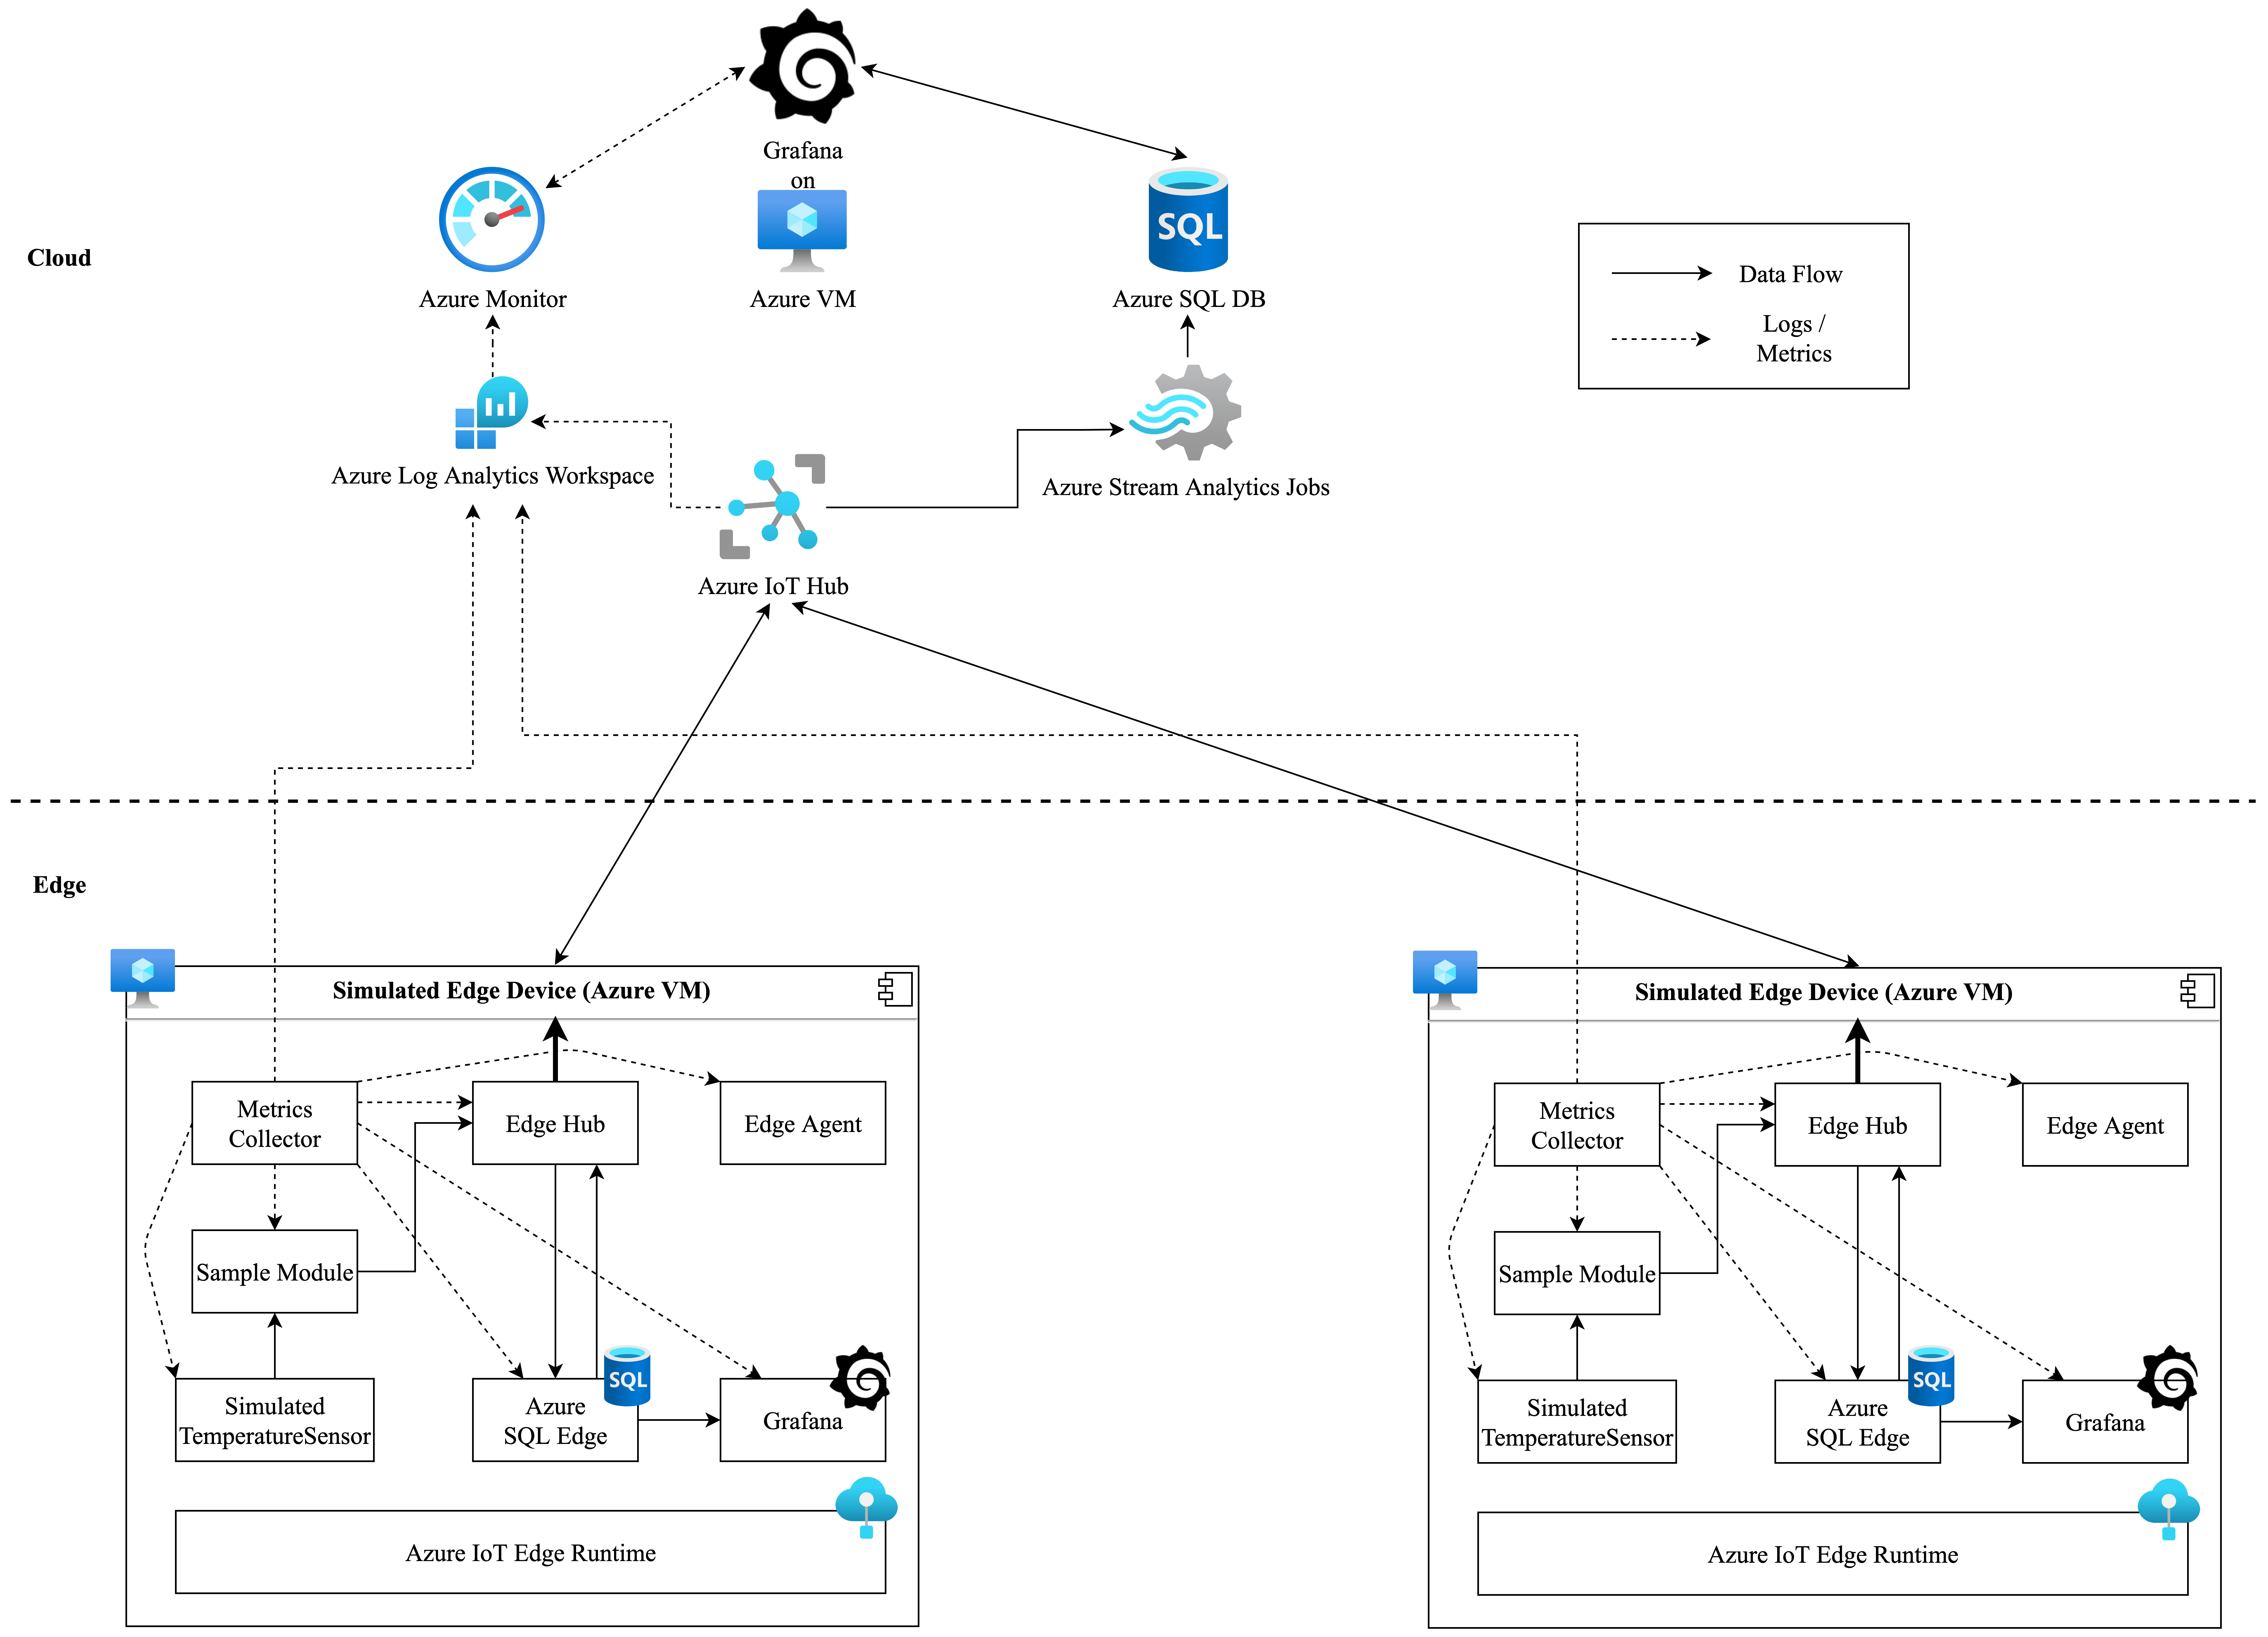
Taking the target use case as a basis, the following system architecture was implemented.

Edge Part
Starting with the edge part of the system, two edge devices were simulated using Azure Virtual Machines. These machines were of type Standard DS1 v2 with 1 vCPU and 3.5 GiB of RAM. Several different components are running on these simulated edge hosts in order to fulfill the use case requirements. The main element is Azure’s IoT Edge software product consisting of the Azure IoT Edge runtime, which is responsible for module management, security aspects, health reporting, and communication management, and the two modules it is made up from, namely the IoT Edge Agent and the IoT Edge Hub. The Edge Agent is responsible for the management, reporting, and security tasks, whereas the Edge Hub is managing all local and device-to-cloud communications as it is a locally running proxy for the Azure IoT Hub service in the cloud. Besides these standard modules, five other components are deployed on the devices. The Simulated Temperature Sensor module is the starting point of the data flow of the PoC. It is a Microsoft-provided sample module simulating temperature data coming from a machine sensor. It was customized to send data in intervals of 60 seconds via MQTT protocol to the Sample Module.
The next module in the data flow is the Sample Module. It is a custom, containerized C# application, which implements basic message pipelining functionality as it receives the temperature data messages from the Simulated Temperature Sensor module and sends them to the Edge Hub module. Its main purpose in the PoC architecture is the demonstration of custom module development and the development lifecycle workflow. A detailed view of this part of the PoC will be covered in the next section. Coming from the Edge Hub module the data then gets written into a SQL database hosted on the edge device. This data persisting component was realized through Azure SQL Edge, an edge-optimized relational database engine deployed as an IoT Edge module. Additionally to the basic table, which is persisting the incoming data, this module also implements a stream processing job, which averages the temperature data in the aforementioned table in intervals of ten minutes and then writes the processed data in another locally persisted table. This process represents the targeted edge analytics part of the system. Furthermore, this averaged data set also gets sent back to the Edge Hub module for later transmission to the cloud part of the system. Similar to this article on KubeEdge by my colleagues, this PoC also leverages Grafana deployed as containerized IoT Edge module for data visualization capabilities. Grafana is an open-source data analytics and visualization tool, which is able to query connected data sources and display data in several forms. It is connected to the Azure SQL Edge database and enables local analytics and visualization tasks on the simulated edge device.
Finally, in order to address the requirements for monitoring and logging of the PoC, the Microsoft provided MetricsCollector module was deployed on the simulated device. This module pulls metrics and logs from the host machine and deployed modules and sends them to the cloud environment either via HTTP directly to the desired Azure Log Analytics Workspace or via MQTT routed through the Edge Hub module. With the second option, additional processing measures have to be implemented to transmit the data from the cloud-side Azure IoT Hub to the Log Analytics Workspace.
Cloud Part
Examining the cloud part of the system, the central component is the Azure IoT Hub. In the context of the PoC, two main capabilities are leveraged: first, it is the central fleet management component providing device monitoring and organization functionalities, also managing all software modules and deployments. Second, it is the core data routing component, as the data from the edge arrives there as device-to-cloud messages and are routed further from this point. Furthermore, if this option is implemented, logs and metrics from the edge device machines arrive there and need to be processed further. Going along the data flow, in order to transmit the data from the prior Azure IoT Hub to the system’s data persistence component, Azure Stream Analytics Jobs are leveraged. Using their capability of filtering data with SQL queries, two jobs are employed in order to ingest the raw and averaged temperature data arriving at the Azure IoT Hub and delivering it to the next component in line, which is an Azure SQL database.
Similar to the edge part, two tables are created in this database in order to persist the arriving temperature data and enable it for further analytics and visualization tasks again using Grafana deployed on an Azure Virtual Machine. Going along the metric flow, the core component is the Azure Log Analytics Workspace, where all logs and metrics collected from the MetricsCollector module are persisted and made available for analytics tasks using Azure Monitor. As mentioned above, two options for transmitting the metrics are available: first and implemented in the PoC, sending the data directly from the edge device via HTTP to the REST API of the Azure Log Analytics Workspace. If this option is not suitable for certain IoT setups because of network constraints or other requirements, a second option of sending the data as device-to-cloud messages via EdgeHub and Azure IoT Hub is available.
In this case, two other components need to be implemented in order to transmit the data into the Azure Log Analytics Workspace. The first one is an Azure Event Hub, which is triggered when metric messages arrive at the IoT Hub and routes the data to the second component, which is a custom Azure Function App, that processes and writes the data into the Log Analytics Workspace. In order to retrieve even more logs from the device fleet, additional components as scoped in the ELMS concept can be implemented. Finally, as mentioned above, the metric data then can be used for analytics and visualization tasks using Azure Monitor and additionally also Grafana leveraging the Grafana Azure Monitor plugin. This way, Grafana serves as the central data and metrics visualization tool in the PoC architecture.
To summarize this, an approach for the underlying simulated IoT use case is scoped implementing an end-to-end data flow with data persistence, analytics, and visualization capabilities at the edge and in the cloud while also providing a competitive monitoring system for device and application data.
DevOps Workflow
In addition to the system architecture, the PoC also focuses on scoping the development lifecycle of the target use case using Azure IoT Edge. Therefore, a comprehensive DevOps workflow is implemented leveraging Azure development tools.

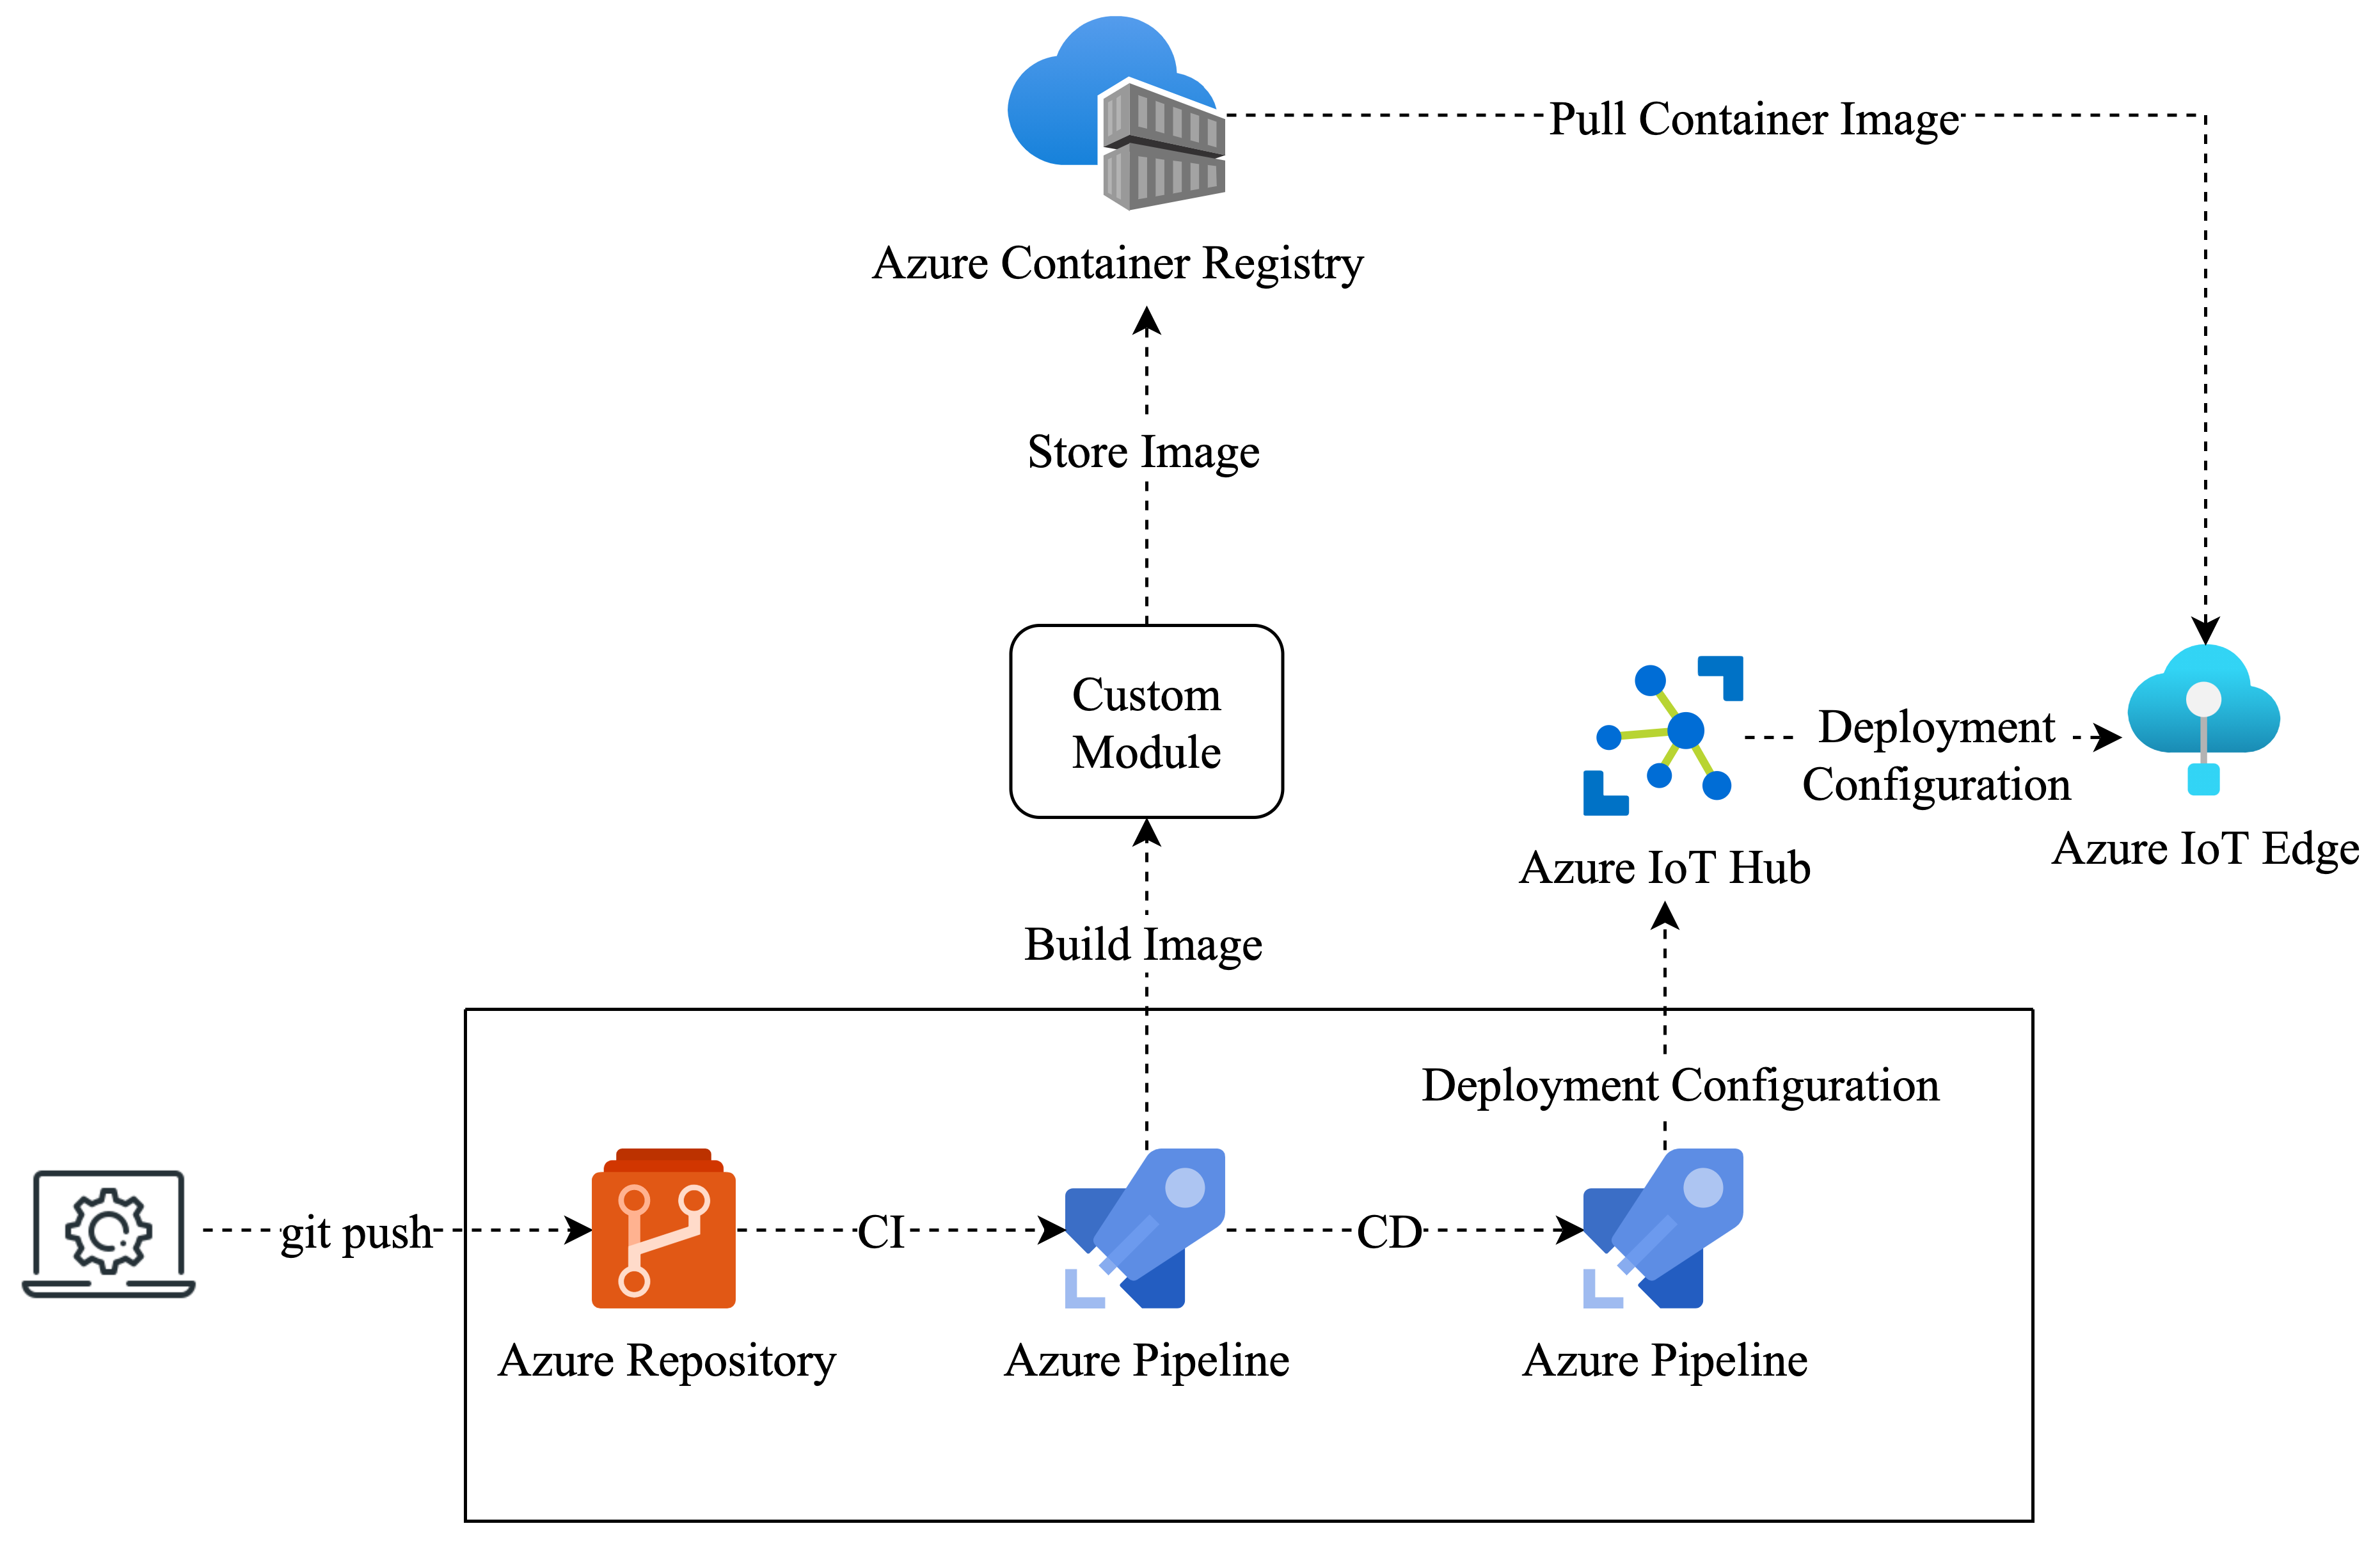
The development workflow starts at the developer’s working machine with a local copy of the code repository hosted within an Azure DevOps Organization. This repository is connected to an Azure Pipeline representing the CI step in the workflow. This step leverages two of the four dedicated, customizable Azure IoT Edge tasks for Azure DevOps, namely build module images and push module images. The CI pipeline is connected to the repository in a way that whenever a new set of changes is pushed to the development or master branch of the repository, the pipeline is triggered. It starts with setting up and installing required dependencies on the Azure-hosted agent machine, where the tasks are supposed to run. Then the first step is executed by building the custom, containerized module images, followed by the second step, which pushes the just built images to the connected Azure Container Registry, where it is stored.
If this first pipeline succeeds, the second Azure Pipeline representing the CD step is triggered. This pipeline then leverages the other two Azure IoT Edge build tasks, namely generate deployment manifest and deploy to IoT Edge devices. Again after preparing the host machine, the first task is executed. On the basis of the deployment.manifest.json file from the application repository and other environment variables, the central file for IoT Edge deployments, the deployment manifest, gets created. The next task then takes this deployment manifest file as input and constructs an Azure CLI command triggering the Azure IoT Hub instance to deploy the specified modules using the configuration of the deployment manifest. While doing this, it pulls the prior pushed container images of the custom module from the Azure Container Registry and includes them in the deployment.
Employing this solution, a full development lifecycle for Azure IoT Edge is implemented. Furthermore, it supports multiple stages for development environments, e.g. production, development, and staging. This is exemplified with the usage of two Azure Virtual Machines as simulated edge devices in the PoC, representing production and development environments. Moreover, the whole workflow of developing a custom module is run through with the Sample Module of the PoC. Also, all used Azure IoT Edge build tasks are open-sourced on GitHub and thereby can be customized for specific needs.
Conclusion
In conclusion, an end-to-end Edge Computing use case was implemented with this PoC. It simulates the generation of temperature sensor data, persists and visualizes this data at the edge, and also covers the storage and analytics in the cloud.
Generally, it was a pleasure for me to work on this during my master’s thesis and implement this concept with the help of Azure IoT Edge and the aforementioned Azure services. For me, it became clear, that Azure IoT Edge and the Azure ecosystem provide a very mature solution for implementing edge use cases and cover all predefined evaluation criteria.
Further Resources
- Azure IoT Edge: https://docs.microsoft.com/en-us/azure/iot-edge/about-iot-edge?view=iotedge-2020-11
- ELMS: https://github.com/Azure-Samples/iotedge-logging-and-monitoring-solution#monitoring-architecture-reference


