Whenever you operate long-running streaming jobs that consume data, do aggregations or sort of business logic, and produce some kind of result, you might have asked yourself the following question: How can I get notified if something “special“ happens? For example, data comes late, duplicates are sent, or an event is sorted out because of bad data quality. In this article, I describe one possible solution with the help of Datadog events, Microsoft Teams, and the Python client API.
Project description and architecture
In one of our current projects, we build a “digital twin“ platform for our customer’s stores. The stores are equipped with different kinds of sensors that measure different aspects of the real world. All those sensors send their raw data to Kafka topics that we consume with long-running Spark Structured Streaming jobs. There are multiple layers of data aggregations, and multiple jobs doing those processing steps: from the pure ingestion of the raw data, over-flattening highly nested data to aggregating and enriching the data with metadata for special use cases.

The overall goal of this project is to enable better and faster business decisions and to optimize various operational processes in and around the stores. To ensure a robust application, we catch several situations in our data explicitly. These situations should not influence the further processing of following events, but we still want to be notified about them, so that we for example can communicate with our stakeholders (that the data of a specific store will not be available right now) or the manufacturer of a sensor (when something seems to be broken on the sensor itself).
Don’t confuse it with alerting
The mentioned “special situations“, we want to get noticed about, do not break anything in our Spark job. They do not result in any exception or unexpected state. That is the reason why we cannot rely on regular alerting that listens to some predefined metrics like memory or CPU consumption and alerts us automatically. Instead, we need to define those situations and corresponding reaction behavior in our application itself. What does that look like?
Implementation
The first step in this process is to implement the logic to recognize the type of event you want to get notified about. In the following example, we want to see if a received event contains bad-quality data. To keep it simple, we assume that the event consists of multiple data points of the same type, depending on the size of the store:
|
1 2 3 |
{"store_id": "store1", "data_points": [1, 7, 3, 1, 2, 9, 8, 9, 9, 4, 2]} {"store_id": "store2", "data_points": [1, 7, 3]} {"store_id": "store3", "data_points": [42]} |
Based on a simple analysis of historical data we can assume that there must be at least 10 data points in every received event. Otherwise, it is of bad quality and will be sorted out:
|
1 2 3 4 5 6 7 8 |
alerting_threshold = 10 few_elements = ( input_df.withColumn("n_elements", func.size("data_points")) .filter(func.col("n_elements") < alerting_threshold) .select("store_id", "n_elements") .collect() ) |
To send an event to Datadog we first need to configure the API client:
|
1 2 3 4 5 6 7 8 9 10 11 12 13 14 15 16 17 18 19 |
from datadog_api_client import ApiClient, Configuration from datadog_api_client.v1.api.events_api import EventsApi from datadog_api_client.v1.model.event_create_request import EventCreateRequest configuration = Configuration() configuration.proxy = "http://example.proxy.my.domain:8000" configuration.api_key["apiKeyAuth"] = " # Are you running your Datadog in the US or EU? configuration.server_variables["site"] = "datadoghq.eu" datadog_api_client = ApiClient(configuration) datadog_api_instance = EventsApi(datadog_api_client) datadog_default_tags = [ "team:my-example-team", "job:my-spark-job", "event_type:spark-job-notification", "env:prod" ] |
For authentication against Datadog you just need an appropriate API key that you created beforehand in your Datadog account. In our case, the platform team manages permissions and authentication and thus provided the API key to us.
Another important aspect here is the choice of appropriate tags. Tags are used in Datadog to find your events and can be used to route them to the right place. We defined different types of tags to group them logically: the team, the Spark job from where the notification was sent, an event type, and the environment (dev, stage, production). Based on those tags we can browse our events in the Datadog web interface later.
For every Spark micro batch, we run through this logic and collect all the information we need to build a message text that will be sent to Datadog:
|
1 2 3 4 5 6 7 8 9 10 11 12 13 14 15 16 17 18 |
from datadog_api_client.v1.model.event_create_request import EventCreateRequest if few_elements: message = "" for row in few_elements: message += f"Found only {row.n_elements} data points in store '{row.store_id}'\n" datadog_api_instance.create_event( body=EventCreateRequest( title=f"Your job found only a few elements!", text=message, tags=datadog_default_tags + [ "source:my.kafka.input.topic", "target:my.kafka.output.topic", ], ) ) |
Let’s try to find our event we just sent in the Datadog event explorer. Please note the query over our chosen tags:

Until here, we sent our events through the Datadog API to Datadog and we found them in the event browser. But how do we get notified automatically in Microsoft Teams now? “Datadog monitors“ are the key. Monitors define some kind of query and thresholds that should be monitored. If the defined thresholds are exceeded, Datadog sends an alert to the configured target:

Please note what the query looks like: We query the tags and simply count the number of events, grouped by event ID. That is important because otherwise, Datadog would only send one notification for every evaluation window. That means if multiple events occur in the same window, it would only send one single alert. With the grouping, we ensure that every single event gets alerted separately.
Also noteworthy: The smallest possible evaluation window is 5 minutes. Depending on the time your event arrives in Datadog, you may have to wait up to 5 minutes to be alerted!
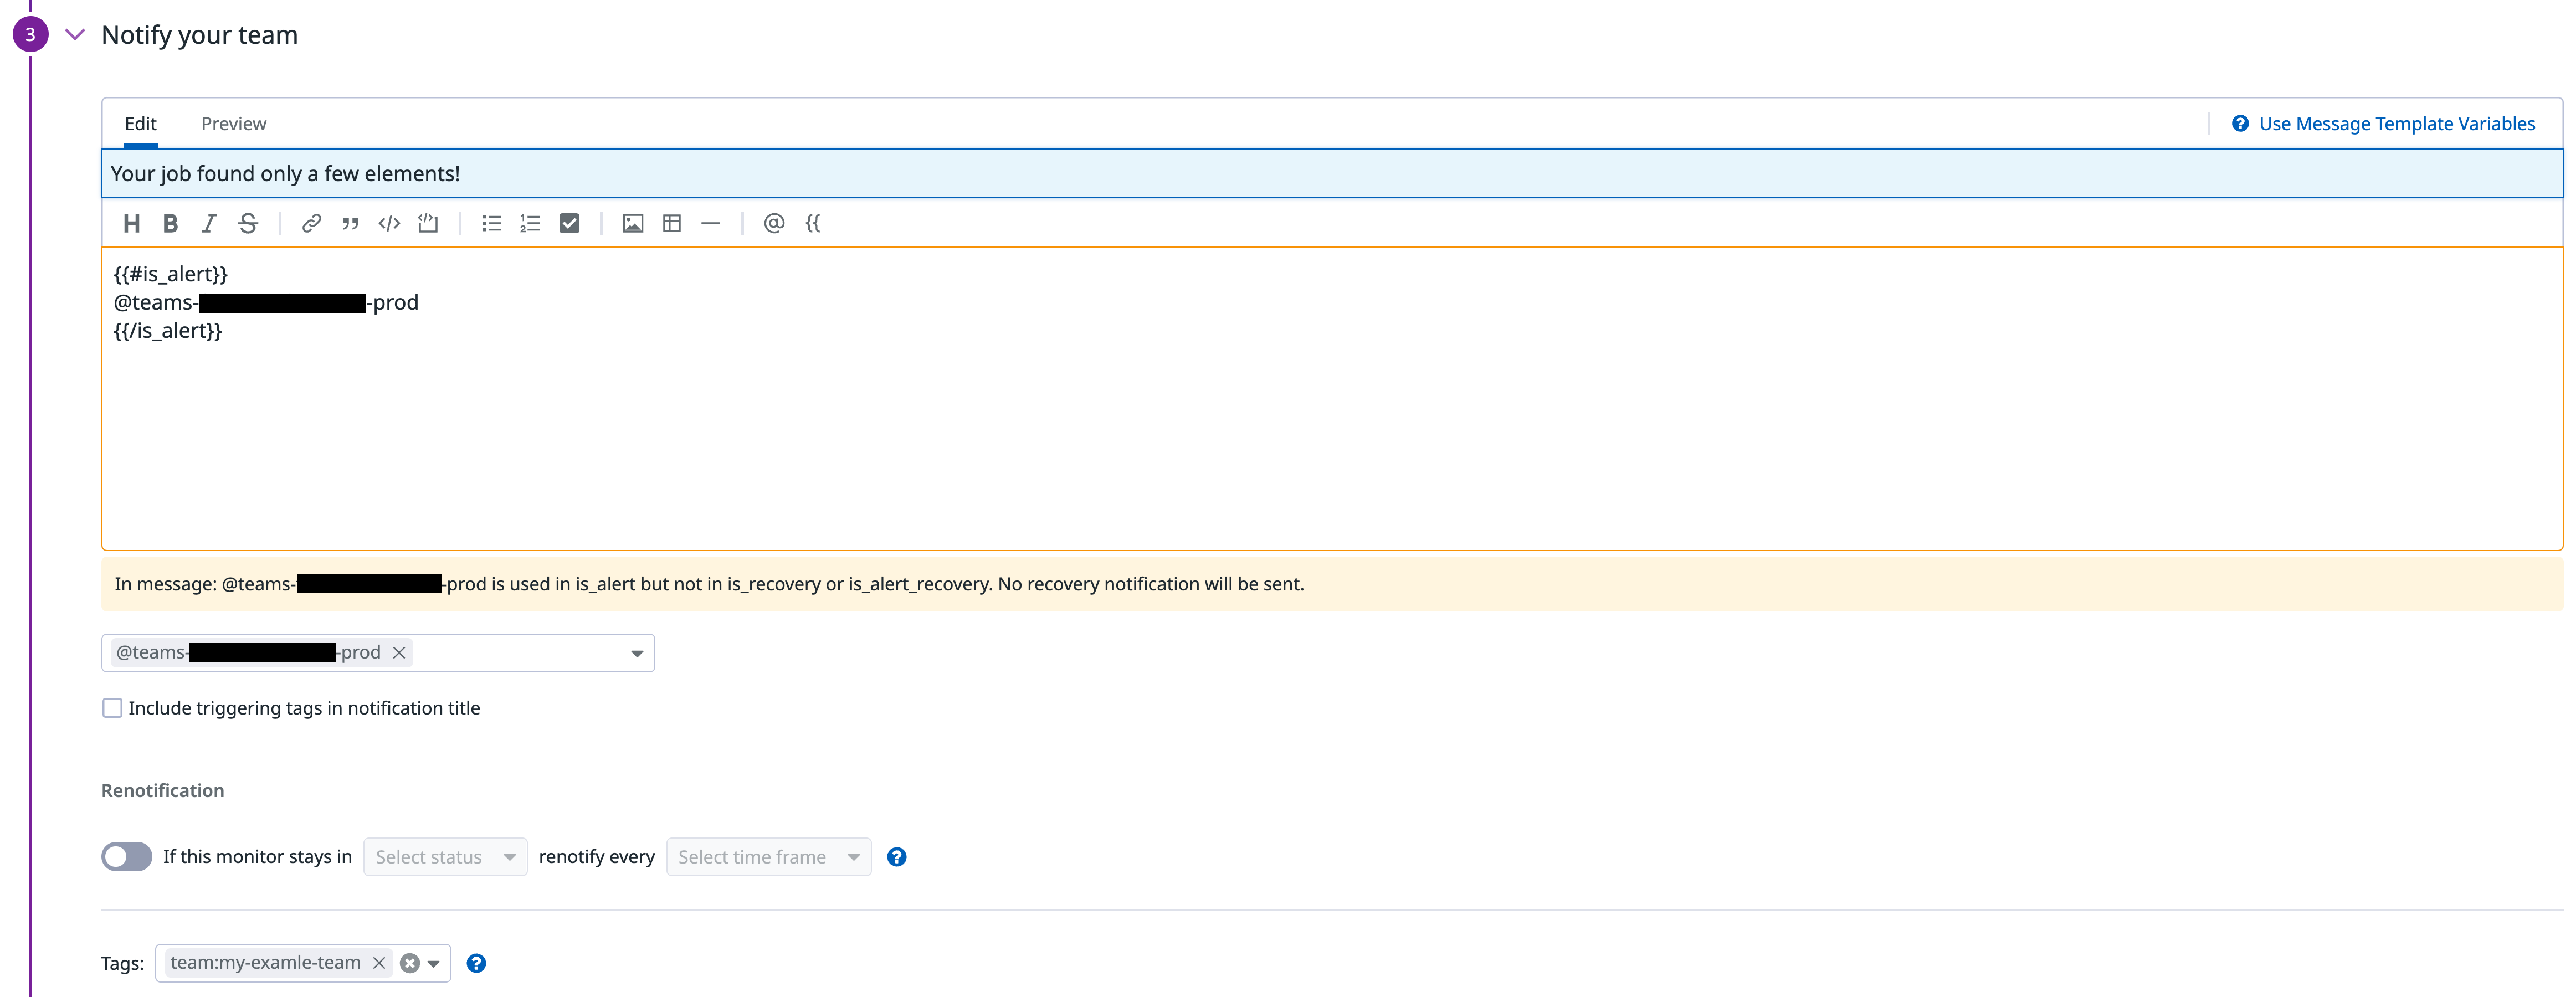
There are a lot of different target systems to which your alert can be sent to. That could be an Opsgenie instance, Microsoft Teams, Slack, etc. Every target must first be configured as an integration in Datadog. Integrations are managed by our central platform team, but in this case, it is as simple as adding a new Teams hook with a given webhook URL that you can copy from the corresponding Teams channel settings. In our case, we chose a Microsoft Teams integration so that we get alerts in different Teams channels, according to the configured message template:

We have different types of alerts or notifications (with different target groups and different purposes) and for every type, we have a separate Teams channel. With the help of the defined tags, we can control which event should be routed to which Teams channel.
Please keep in mind that the text field of a Datadog event is limited to 4.000 characters. We figured out two different strategies to overcome this limitation:
- Truncate the message text (if it does not contain very critical details at the end)
- Build some kind of pagination, where the message is split up into chunks and sent separately
Alternative solutions
I’m pretty sure there are a lot more options to achieve the functionality of getting notified about events in your application. I just want to mention two more options that work a little bit differently.
You could write custom metrics for Datadog and set alerts based on those metrics. This approach was not suitable to our use case because a metric is always a number and no free text can be added. But whenever you have things that can be “counted“ or “summarized“ in one number, that could be a good option.
Another idea is to write all the needed information in your application logs (probably you want to do this anyway) and ship them to Datadog. There you could configure a monitor based on your logs. This approach can be very expensive depending on the number of logs and the cardinality of the tags you ship to Datadog. Furthermore, it was not supported by our platform team at the time of writing.
We decided to use the event-based approach for simplicity and ease of use.
Summary: Using Datadog Events to Observe Your Streaming Job
I showed how we use Datadog and the Python client API to observe different types of events occurring in our Spark Structured streaming pipelines. Those events are not breaking anything in our applications, but are worth being notified about. So instead of utilizing our already existing default monitoring/alerting mechanisms that listen to different “technical“ metrics like CPU and memory usage, we instead decided to send explicit events from our code to Datadog.
This is pretty simple and also helps in understanding the code itself because special situations that can occur while processing the incoming events are explicitly expressed as a piece of code that notify about the event.
Please note that sending messages directly to Microsoft Teams was just a “quick win“ solution for us. A more sophisticated approach would be to synchronize your Datadog events to a full incident management system like Opsgenie with the Opsgenie integration. There you can handle the notifications together with alerts and all kinds of incidents in one central platform.


