Notice:
This post is older than 5 years – the content might be outdated.
Kubernetes is a powerful system on its own. But what really elevates its usefulness to new heights are the many add-ons and tools. They add functionality like monitoring, diagnostics, logging, and more. I want to talk about a few of these tools and show how well they work with Kubernetes on Windows.
Foreword: Kubernetes on Windows
Windows is still a new player in the Kubernetes ecosystem. With a stable release that is not even a year old, there are virtually no tools that natively support Windows. This means that setting up these tools will be a little more difficult than normal and there is no guarantee that they will end up working as advertised.
Sonobuoy: Diagnostic Tool
Sonobuoy is a diagnostic tool that is easily customizable with plugins. To obtain general information about your cluster, Sonobuoy queries the kube-apiserver. Plugins gather additional information with end-to-end conformance tests or system-log aggregation. The advantage of Sonobuoy is that it will do all this automatically. For a standard run, you just have to have Sonobuoy and kubectl installed on your host. When you tell Sonobuoy to run next it will gather all the information and run all the tests on its own. The results will be presented to you after the run is completed.
The first step in bringing this tool to Windows was to understand the different parts of the system. Sonobuoy deploys a master pod. This pod queries the API objects with the help of Kubernetes’ own client-go. Its second job is to create the requested plugins. It dispatches worker pods to the nodes in your cluster. After the plugins finish their tasks, they send the collected data to the master pod via an HTTP server.

By default, Sonobuoy offers two plugins: systemd-logs and e2. Systemd-logs queries each node’s systemd journal. This makes it rather difficult to implement on Windows. For this to work you would need a process running directly on the host, outside of your Kubernetes cluster. This goes against some core design principle of Kubernetes.
The e2e plugins run Kubernetes end-to-end tests. Kubernetes, and in our case specifically SIG-Windows, provides these tests for us. There are different ways to run them: you can either use Kubetest, Ginkgo, or you just run the test binary directly. Because tests are started from inside a pod and have to run on Windows, I chose to build and run the test binary directly. While the other options work as well, you would have to resolve some dependencies first.
There is a problem with the way plugins are executed in mixed clusters. The Sonobuoy master pod creates plugins internally based on a template. You can configure this template, but some options important for Windows are missing. Sometimes Linux containers are scheduled on Windows nodes and vice versa. This results in an error state that you have to fix manually.
Another problem occurs when, after Sonobuoy finishes, you want to retrieve the results. This fails because of a Golang library that behaves differently on Windows than it does on Linux, in addition to some other implementation details. I had to change parts of the source code to adapt it to Windows. These two problems mean that it was virtually impossible to get Sonobuoy to run on a mixed cluster.
To review, Sonobuoy is still a very useful tool. It lets you quickly summarize and analyze your entire cluster. The communication with the kube-apiserver works just like on Linux. It provides you with useful information about your cluster and while there are some problems with the standard plugins, you can always write your own.
Grafana: Data Visualization
Grafana is a visualization tool that works with a variety of different data sources. This includes Prometheus and Loki, two tools we’ll talk about later in this article.
These plugins expose their data as an API endpoint for Grafana to collect and then visualize. As always, you have to build the Docker image yourself. Apart from that, Grafana was actually the easiest of the plugins to set up. Build the container image, run it as a pod, add a LoadBalancer to interact with the GUI from your computer, and you should be fine. Now you are able to add all the data sources you want, whether they’re coming from a Linux or a Windows node should not matter.
Prometheus: Monitoring System
Prometheus is a popular monitoring system with native integration into Kubernetes. It is used to collect metrics about your containers, pods, nodes, and clusters. Additionally, Prometheus lets you program alerts to warn you if something in your cluster is going wrong. You can configure how Prometheus should contact you. Either via email, notification systems or your favourite chat platform. And if there is no native support, you can use the webhook receiver for integration.
Prometheus stores your data as a time series identified by metric name and key/value pairs. To work with the data Prometheus includes their own query language PromQL, which is short for Prometheus Query Language. To get the data Prometheus uses exporters: there are lots of different exporters for a multitude of software, hardware, and databases (a complete overview can be found in the official docs). And if the particular exporter you need doesn’t exist yet you can always write your own.
Fortunately, for use with Kubernetes there is no need for an exporter as it is natively supported. Prometheus communicates directly with the metrics-server. Through this server, it gets information about your pods, services, node and more. But if you want metrics about your Windows hosts you need an exporter. Luckily someone out there already wrote one called wmi_exporter.
Monitoring the containers directly is also possible. Linux containers use a tool called cAdvisor that has native support for Docker containers and exposes Prometheus metrics out of the box. On Windows there is a package named winstats that reads container metrics from the kubelet and in turn returns standard cAdvisor data structures so Prometheus can process it.
 When setting up Prometheus on your Windows cluster you have to build your own container image, as there is no official image yet. But setting it up is not much different than on Linux, and it should work without much trouble.
Loki: Log Aggregation
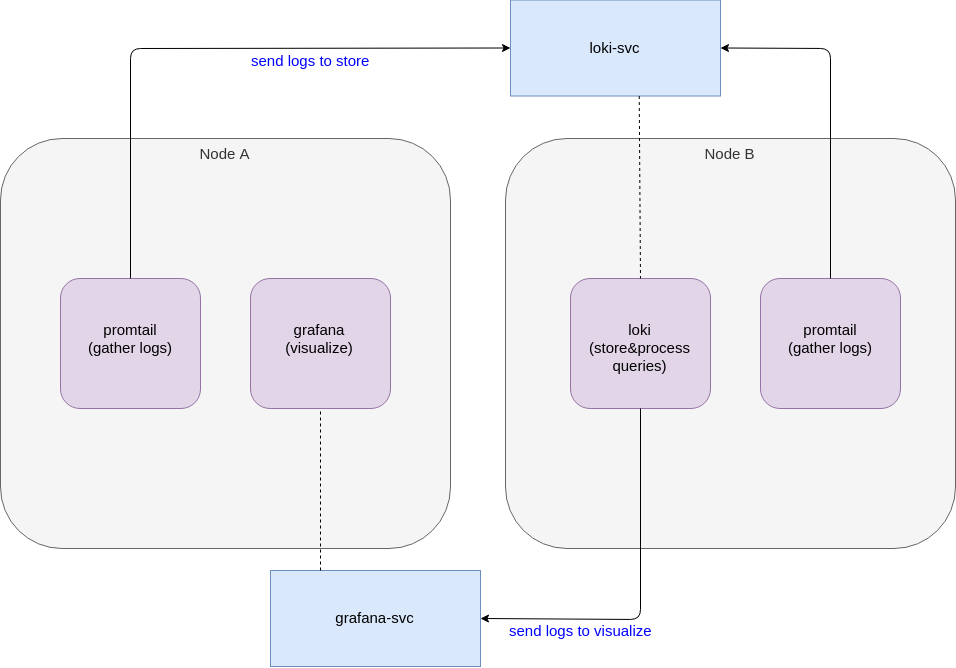
Loki is a log aggregating system inspired by Prometheus. It is very new and still in beta at the time of writing. Loki does not index the contents of the logs but instead uses the same labels as Prometheus. This happens for every individual log stream. Because of that, you can switch between logs and metrics using the same labels if you’re running Loki in combination with Prometheus. Loki consists of three components:
- Loki is the server that stores the logs and processes the PromQL queries.
- Promtail is the agent running on each node responsible for gathering the logs and sending them to Loki.
- Grafana is a tool to visualize your data (see above).
About a month ago when I was testing Loki there was no official Windows release. There were still Linux dependencies in the project that had to be resolved first. Then, with version 0.2.0 they also released a Windows binary.
Configuring promtail is a little different on Windows. It natively uses a single ConfigMap to configure all promtail agents. In a mixed cluster, this is not possible for a few reasons. Paths are generally different (Sidenote: SIG-Windows decided to emulate Linux paths so you end up with paths like C:\var\logs). Additionally, Docker saves logs in a different location. This makes it necessary to have two ConfigMaps, one for agents running in Windows containers and one for agents running in Linux containers.
Once you configure this correctly there should be no difference to Loki on Linux. The promtail agents gather logs and send them to the main Loki server where they are processed and stored. Then, you can visualize your metrics in Grafana a usual.
Conclusion
There are a lot of useful additions to Kubernetes, but official Windows support for almost all of these projects is nonexistent. For some tools there is a Windows binary available but even this is a rare occurrence. To be able to use these plugins you have to be ready to build your own images, deal with and resolve dependency issues, understand how they work, and sometimes re-write the code. In short, you have to spend time and resources, more so than on Linux, to make sure they work correctly.