
Notice:
This post is older than 5 years – the content might be outdated.
tl;dr
Ever wanted to change some behaviour of your application during development without the need to recompile it? LLDB has got you covered. This article explains how LLDB is used through its CLI, how simple breakpoints are created, and finally how they can be used to non-destructively alter current application behaviour.
Introduction
The LLDB debugger is part of the LLVM project and has been your debugger of choice since Xcode 6 if you develop for Apple’s ecosystem.
On macOS it is part of Xcode or installs itself by typing lldb into the command shell. On Debian-based Linux systems it can be installed via apt get, and for all other systems the recommended way is to build it from source via CMake.
Breakpoints in Theory
As software developers we use a debugger and its most significant feature—the breakpoint—quite a lot, mostly unaware if the breakpoint that is currently used is a symbolic, non-symbolic, hardware, or software breakpoint.
Software Breakpoint
Software breakpoints, as the name implies, are breakpoints within the binary that is being debugged. It works by replacing an existing opcode at the position the debugger should halt our program with an opcode that forces the CPU to emit a software interrupt (a.k.a. trap). After the breakpoint is hit and the interrupt is sent, the debugger receives the interrupt signal, replaces the opcode with the original opcode and usually waits for the next command. This could be something like step to next instruction or continue program execution until next breakpoint is hit.
Hardware Breakpoint
A hardware breakpoint, you might have already guessed it, is a breakpoint that uses dedicated hardware, e.g. a x86 debug register, to observe the current state of the CPU and halt program execution. Because it relies on dedicated hardware features, the number of hardware breakpoints that can be used is significantly lower (highly depends on the processor’s architecture, but generally less than a dozen) than the number of software breakpoints that can be used.
Non-Symbolic Breakpoint
A Non-Symbolic breakpoint is used by the IDE if a line of code is marked for the debugger to stop program execution. The location within the source code is translated into an execution address where the debugger actually places the breakpoint. Non-symbolic breakpoints stick to their specified location within the source code or binary and do not „move“ with the instruction / source code. This characteristic makes it hard to use these kinds of breakpoints for automating tasks with LLDB.
Symbolic Breakpoint
Symbolic breakpoints, as opposed to non-symbolic breakpoints, do not stick to a line of code or a specific binary address. They are bound to a symbol, e.g. the name of a function. Which means that no matter where the function is located within the source code—or even binary if it is a global symbol—the breakpoint moves with it. A disadvantage of symbolic breakpoints is, that they cannot be easily placed in the middle or end of a function.
Breakpoints in Practice
Before we start to deep dive into LLDB and how breakpoints can be used to alter code execution, let’s take a step back and get familiar with the command line interface of LLDB as well as how breakpoints are created manually without the need of an IDE. After typing lldb into a shell a prompt should be visible like the one below.
|
1 |
$ (lldb) |
Create a Breakpoint
The following command creates an IDE-like non-symbolic breakpoint at line 3 in file main.c.
|
1 |
$ (lldb) breakpoint set --file main.c --line 3 |
which can be abbreviated to
|
1 |
$ (lldb) br s -f main.c -l 3 |
because the CLI will understand our input as long as there is no ambiguity with other LLDB CLI commands. Up to now we are as good or bad as any common IDE might be in creating breakpoints.
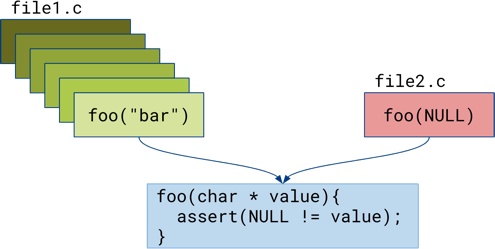
Conditional Breakpoint
Just creating a breakpoint might not always be enough in some, mostly hard to debug use cases. For example let’s assume a situation as described in the picture below. The green boxes represent the callers of foo(char * value) that do not trigger an assertion whereas the red box represents the caller that triggers the assertion which is the „bug“.
To debug the defect we could alter our source code e.g. by inserting something like
|
1 2 3 4 5 |
if (NULL == value) { printf("Make a breakpoint here"); } |
at the beginning of foo(char * value) and add a breakpoint to the printf() statement. This is something I personally try to prevent at any cost, because
- altering the source code might change runtime behaviour and the occurrence of the defect.
- code added for debugging purposes might be part of the next release, which in my case is more likely.
To circumvent this, a symbolic breakpoint is created on foo(char * value) by entering the following command into the LLDB CLI:
|
1 |
$ (lldb) br s -n foo |
This is currently not enough, because the breakpoint stops every time foo(char * value) is called, which results in a lot of false positive debugger hits during the debug session. To avoid this, a condition is added to the breakpoint with the purpose of stopping only if the given value to foo(...)is NULL.
|
1 |
$ (lldb) br s -n foo -c "value == NULL" |
The breakpoint will now stop program execution only if the given value is NULL whereas every other call to foo(...) is ignored.
A condition can be more than just a simple comparison. It can be everything whereupon its result resolves to an integer value and the condition is fulfilled if the result is 0. For example the next breakpoint which is again attached to foo(...) uses the C function strcmp to halt program execution if value is equal to bar.
|
1 |
$ (lldb) br s -n foo -c "(int)strcmp(value, 'bar')" |
MetaBreakpoint: Breakpoints Modifying Breakpoints
Sometimes a breakpoint with a condition might not be the perfect choice to debug a misbehaviour. Let’s take a look at the following image, the program execution might crash or just misbehave if our well known function foo(...) is called through the execution path of the caller represented with the red box. Because all callers use the same argument "bar" a conditional breakpoint won’t help to debug this scenario.

Without further knowledge of how MetaBreakpoints (which is not an official name by LLDB, the term is used within the article to describe breakpoints that do not halt program execution and are solely used to alter other breakpoints) can be used, a first approach could be to add a breakpoint at the position foo("bar") within the red box. Let’s assume this is in file file4.c at line 3. The corresponding breakpoint is:
|
1 |
$ (lldb) br s -f file4.c -l 3 |
A second breakpoint is needed at foo(...) which is created by:
|
1 |
$ (lldb) br s -n foo -N bp_foo -d |
This time the breakpoint gets a name via -N which is useful if the breakpoint is referenced later. The parameter -d deactivates the breakpoint right from the start. When the first breakpoint is hit, which means the execution path „is in the red box“, the command
|
1 |
$ (lldb) br enable -N bp_foo |
will enable the previously deactivated breakpoint named bp_foo. It can be assumed that after the debugger stops again, the caller of foo(...) is the one from the red box.
This approach can be completely automated using a MetaBreakpoint. Its purpose is to enable the disabled breakpoint and continue program execution after it has been hit.
|
1 2 3 |
$ (lldb) br s -n foo -N bp_foo -d $ (lldb) br s -f file4.c -l 3 -C "br en bp_foo" -G true |
At first a deactivated breakpoint named bp_foo on function foo(...) is created as already seen in the examples above. Afterwards the MetaBreakpoint is created with two parameters -C "br en bp_foo" which executes the command that enables the disabled breakpoint and -G true to automatically continue program execution after the MetaBreakpoint has been hit.
The technique from above can be useful to follow the critical execution path of a stack trace, by attaching a MetaBreakpoint onto every stack frame position of interest and eventually halt program execution if all preconditions are met.
Example Usage of MetaBreakpoints
The previous topic introduced MetaBreakpoints as a technique that uses breakpoints to alter existing breakpoints or more generally to execute a command and automatically continue program execution.
printf()-like Debugging
From time to time everything that is needed is a good old printf() state to visually indicate what path the program executes or how many times a function has been called. Most of the time this goal is achieved by adding a printf() statement in the code. For example like so:
|
1 2 3 4 5 6 7 8 9 10 11 12 13 14 15 |
int main(int argc, char *argv[]) { printf("Line 1"); something(); printf("Line 2"); some_other_thing(); printf("Line 3"); [...] } |
As mentioned before, this approach has two drawbacks: it alters the current code and might result in seeing this „feature“ in the next release (information leak, here we go). The same printf() behaviour as above can be achieved with a MetaBreakpoint like the one below:
|
1 2 3 4 5 6 7 |
$ (lldb) br s -p . -X main -f main.c -G true br command add -s python print("Line:{}".format(frame.GetLineEntry().GetLine())) DONE |
At first, a breakpoint is created with a regular expression -p where the expression itself is . which matches every line of code. With -X main the regular expression is limited to a function named main and because main is a very common function name which might exist quite a lot, -f main.c limits the regular expression even further to a file named main.c. As mentioned before -G true makes sure, that the breakpoint automatically continues if hit. By then there is an auto-continue breakpoint on each line in function main(...). The subsequent command
|
1 |
$ (lldb) br command add -s python |
tells LLDB that a multiline command for the last created breakpoint is about to start. By using -s python the command itself will use Python as scripting language and its bridging interface to LLDB. In one of the previous examples -C is used to execute a command, which is handy for one-liners. For everything else br command add should be preferred. If the command is to be attached to a breakpoint which is not the last created one, the last parameter can be the number of the breakpoint or its name (remember -N).
|
1 2 3 |
print("Line:{}".format(frame.GetLineEntry().GetLine())) DONE |
When the bridging interface is used, LLDB wraps the Python code into a function with three parameters: frame, bp_loc, and dict. The current line of source code information can be retrieved from frame. By putting everything into a print statement, the breakpoint prints each line number it executes into the CLI. Lastly the multiline command is closed by DONE.
Further details on how to use the scripting interface with Python can be seen here.
DRY and Commands
As mentioned before a command is, if not further specified, automatically attached to the last created breakpoint. But a command is not tied to a single breakpoint it can be either attached to multiple breakpoints by adding the number of breakpoints at the end of br command add,
|
1 2 3 |
$ (lldb) br command add 1 2 3 4 $ (lldb) br command add 1-4 |
or if the same name, e.g. -N bp_printf is used for a couple of breakpoints, they can all get the same command by using that name during command creation.
|
1 |
$ (lldb) br command add bp_printf |
Mute AVPlayer on Initialisation
In one of my last projects an instance of AVPlayer1 has been used with the purpose of immediately starting to play an audio/video stream after the app starts, which I found a little bit annoying. There have been four options to choose from to stop this—from my point of view—unwanted behaviour:
- Mute the computer during development to mute the iOS simulator, which is not acceptable because my music would also be gone.
- Mute the AVPlayer via the apps UI within the iOS Simulator. Not acceptable either, takes too much effort.
- Don’t use the Xcode simulator anymore and deploy on a real iDevice and mute it. Not an option, takes longer to deploy than on the simulator and switching screen size is not so easy, especially if there is only a single device available.
- Use LLDB and fix it. That’s the way to go.
The goal is to mute an AVPlayer instance immediately after its creation. The problem is, that AVPlayer is part of Apple’s ecosystem and sources are not publicly available. Furthermore LLDB does not have an option out of the box to set a breakpoint at the end of a function.
Solution #1
A first and simple approach is to just add a breakpoint onto the next line after AVPlayer is initialised.
|
1 2 3 4 5 6 7 |
func do() { let player = AVPlayer(playerItem: nil) [...] } |
Let’s assume that the example code from above is in file Player.swift and the initialisation is in line 2. The breakpoint to mute the AVPlayer will look like this:
|
1 |
$ (lldb) br s -l 3 -f Player.swift -C "call player.isMuted = true" -G true |
The only thing that might not look familiar is the command itself. All the executed commands so far were either a Python script or a breakpoint instruction. call, which is an abbreviation for expression --, evaluates an expression on the current thread of the program that is being debugged. So, if the breakpoint is hit, LLDB evaluates the expression player.isMuted = true and mutes the current instance of AVPlayer.
This solution might not last forever because the breakpoint is tied to a specific line and this might not be the only place an AVPlayer is initialised.
Solution #2
To bypass both flaws the only solution that will work reliably is to either add a breakpoint at the end of the initialisation function or immediately after it. Before a breakpoint can be added to the end of AVPlayer(playerItem: nil) which eventually calls AVPlayer() or if written in Objective-C [AVPlayer init] its current address space must be resolved.
|
1 2 3 4 5 6 7 8 9 10 11 |
$ (lldb) image lookup -vrn "\[AVPlayer init\]" 1 match found in [...] AVFoundation: Address: AVFoundation[0x00000000000852e4] [...] [0x00007fff208aa2e4-0x00007fff208aa854), name="-[AVPlayer init]" [...] |
The result contains the relative address 0x852e4 within AVFoundation (the module/library AVPlayer belongs to) and the current absolute address space [0x7fff208aa2e4-0x7fff208aa854). With this information it is possible to create a breakpoint at the end of the [AVPlayer init] function via
|
1 |
$ (lldb) br s -a 0x852e4+0x56f -s AVFoundation |
The important parameter in this case is -s AVFoundation to be able to use relative or file based addresses instead of absolute addresses which change every time the binary is executed due to ASLR. The question is how to execute the mute expression, because within the AVFoundation library where the breakpoint now resides there are no variables available. This can be checked with the frame variable command.
Actually the variables are still available but their names are far from being intuitively readable, because they are just addresses/values on the stack/heap or register. One of these registers is—on x86_64 architectures—rax which contains the result value of a function after it returns. This means, that if the above breakpoint is hit the rax register contains the return value of [AVPlayer init] which is a pointer to the created AVPlayer instance on the heap.
With all information from above the final breakpoint to achieve our goal looks like this:
|
1 2 3 4 5 6 7 8 9 |
$ (lldb) br s -a 0x852e4+0x56f -s AVFoundation br command add exp -l objc -- [(AVPlayer *)$rax setMuted: @YES] continue DONE |
Although the example code is in Swift, expression is used with -l objc and instructs LLDB to evaluate the following expression as an ObjC construct, as it is much easier to operate and cast pointers in ObjC than it is in Swift. Finally continue automatically continues program execution after the command did execute which is equivalent to using -G true.
Solution #3
The solution does have one drawback, besides being tied to x86_64 platforms, which in iOS development is the architecture of the simulator, it might not work or must be updated every time the iOS version changes, because the internal libraries may change and with them their relative addresses. But this can be solved too, by extending the solution from above with a symbolic breakpoint onto [AVPlayer init].
|
1 2 3 4 5 6 7 8 9 10 11 12 13 |
$ (lldb) br s -S "-[AVPlayer init]" -K false br command add settings set target.language objc br s -a `(unsigned long)*(unsigned long *)$rsp` -o true -C "exp -l objc -- [(AVPlayer *)$rax setMuted: @YES]" -G true settings set target.language swift continue DONE |
Let’s dig into this line by line.
|
1 |
$ (lldb) br s -S "-[AVPlayer init]" -K false |
First a symbolic breakpoint is added onto the initialisation function of AVPlayer. By using -S the name of the selector (in ObjC functions are normally not called directly instead they are resolved by the runtime via a selector) instead of a function name is used to specify the location the breakpoint is attached to. With -K false the function prologue is not skipped and the breakpoint is attached to the function as early as possible. This is important if values from the caller stack are referenced which this solution does.
|
1 |
settings set target.language objc |
The default language interpreter LLDB uses from now on is ObjC, because it is easier to use pointers, furthermore expressions in backticks like $rsp
|
1 |
$ (lldb) br s -a `(unsigned long)*(unsigned long *)$rsp` -o true -C "exp -l objc -- [(AVPlayer *)$rax setMuted: @YES]" -G true |
$rsp is the register that points onto the current top of the stack which contains the return address [AVPlayer init] calls immediately after initialisation did finish. Which means the above breakpoint will be hit after AVPlayer is fully initialised and before any subsequent code is executed. By using -o true the breakpoint will be deleted after first hit to ensure that the command is only executed once. The breakpoint command itself is the same that has already been used within the relative address solution.
This solution is still tied to x86_64 architecture platforms but it does not matter anymore which version of iOS is running. Due to the usage of a symbolic breakpoint as the entrance, the subsequent breakpoints can safely use absolut address information provided by the currently running binary.
Control Flow Manipulation
Changing the behaviour of an application during developmentin most instances involves to recompile parts of the project. This can be time consuming or just annoying. Luckily LLDB has a couple of commands in its toolbox that allows changing the control flow during runtime without the need to recompile the binary. Furthermore, if tied to a breakpoint the control flow changes can be switched on and off and automatically set up.
thread jump
|
1 2 3 4 5 6 7 8 9 10 11 12 13 14 15 16 17 18 19 |
static int can_pass() { return 0; } int main(int argc, char *argv[]) { if (0 == can_pass()) { printf("Better luck next time\n"); exit(1); } printf("Hello lldb\n"); } |
Take the example code from above, currently there is no chance it prints Hello lldb. This can be—of course—changed without changing the code itself, by using the thread command. The command itself has a couple of subcommands with the primarily focus on changing, stepping, and showing information of the current thread. One of these subcommands is jump, which allows to change the programs counter and therefore the order of program execution.
The following breakpoint which is attached to main uses thread jump to alter the control flow every time main is called.
|
1 |
$ (lldb) br s -n main -C "thread jump -b 4" -G true |
The important part of the auto-continue breakpoint is the command thread jump -b 4 which results in omitting the next 4 lines of code before continuing code execution and eventually printing Hello lldb.
One of the disadvantages of thread jump is that it can only be used with absolute jump information, like jump over the next x lines, jump to line in file, or jump to absolut address. In most cases these kind of information are not stable during development and might therefore change, whereupon the breakpoint that injects the jump command has to be updated accordingly to work as expected.
thread return
The mentioned disadvantage of thread jump can be avoided by using a different technique to change control flow behaviour. Instead of manipulating the affected lines of code directly the idea is to manipulate other parts of the program which in turn results in the desired behaviour. For the given example this means changing the return value of can_pass() from 0 to 1.
Which, of course, can be done through LLDB. The command to use is thread just like before, but this time with the subcommand return to prematurely return from a stack frame, thereby short-circuiting its execution.
To manipulate the return value of can_pass() a symbolic breakpoint is added to it.
|
1 |
$ (lldb) br s -n can_pass -C "thread return 1" -G true |
The composition of the auto continuing breakpoint that acts as the injector is always the same. This time the command short-circuits the function can_pass() and automatically puts the return value 1 into the desired return register of the current architecture. Unfortunately the usage of return values is limited to integer and float types. This means a command of the form
|
1 |
-C "thread return 'foo'" |
won’t work and extra efforts have to be taken for this use case, which I’ll show next.
|
1 2 3 4 5 6 7 8 9 10 11 12 13 14 15 16 17 18 19 |
static char const * secret() { return "foo"; } int main(int argc, char *argv[]) { if (strcmp("bar", secret())) { printf("Better luck next time\n"); exit(1); } printf("Hello lldb\n"); } |
To manipulate the return value of secret() so it matches the already hard coded one, a new String has to be generated. As mentioned before LLDB can evaluate expression on the fly as long as it is valid C/ObjC/C++/Swift2 code. A new String value is created with LLDB by executing:
|
1 |
expression -- auto $bar = "bar" |
The only thing that is left is to return the actual string value, which is done by returning the pointer address of the first character of the string.
|
1 |
thread return `$bar` |
The backticks around $bar are important so that the variable is evaluated to its actual value before being processed any further. The result is the needed pointer address, which is nothing more than an integer value.
With all the explanation from above the production ready breakpoint looks like this:
|
1 2 3 4 5 6 7 |
$ (lldb) br s -n secret -G true br command add expression -- auto $bar = "bar" thread return `$bar` DONE |
Binary Patch Breakpoints
There is only one caveat while using control flow manipulation commands like thread return or thread jump: they slow down program execution. The impact is negligible as long as the manipulated function is called a couple of times, but is noticeable if called e.g. 60 times per second (maybe it’s in a ScrollView and every time a new cell is rendered a breakpoint kicks in to manipulate the code).
If the injection point is chosen well to manipulate the control flow, e.g. it can be reduced to a 0/1 decision, a possible solution is to binary patch the function.
Taking the code example from thread return the idea is to change
|
1 2 3 4 5 |
static int can_pass() { return 0; } |
into
|
1 2 3 4 5 |
static int can_pass() { return 1; } |
after the binary has been compiled and is already executing.
The current address of the function is determined via a breakpoint, which shouldn’t be a surprise by now, and the usage of the Python bridge, which offers a convenient way to change memory content of the current running process.
The last part that is missing to accomplish the goal is the actual binary patch. This can be achieved e.g. by compiling a small program and disassemble its content including op-codes with otool -tVj a.out. The result should look similar to the one below.
|
1 2 3 4 5 6 7 8 9 10 11 |
_can_pass: 55 push %rbp 6a 01 push $0x1 58 pop %rax 5d pop %rbp c3 ret |
Putting all together the resulting binary patch breakpoint that overwrites can_pass() to always return 1 instead of 0 is:
|
1 2 3 4 5 6 7 8 9 10 11 12 13 14 15 16 17 |
$ (lldb) br s -n can_pass -o true -K false br command add -s python patch = '\x55\x6a\x01\x58\x5d\xc3' addr = bp_loc.GetLoadAddress() error = lldb.SBError() proc = frame.GetThread().GetProcess() result = proc.WriteMemory(addr, patch, error) proc.Continue() DONE |
Caution: this will only work if the binary patch takes less or equal space than the function being replaced, otherwise unknown parts will be overwritten without knowing the impact which results most likely in a program crash.
Unlike the solutions before, this patch is persistent and therefore not detachable. To withdraw the changes, the breakpoint has to be disabled and the binary needs to be restarted.
Persisting Breakpoints
Instead of adding a breakpoint every time the binary is started manually, like in the examples of this article, the ~/.lldbinit file can be used to:
- Add settings that are used every time LLDB is started, like
1settings set target.x86-disassembly-flavor intel
to change the disassembly flavour from AT&T to Intel. - Add command aliases to define custom commands that are used often.
- Execute LLDB commands, like the ones from the article to automatically inject a breakpoint during startup.
If LLDB commands are added directly into ~/.lldbinit it should be noted that they are executed every time LLDB starts, no matter which binary is being debugged, which might result in unexpected behaviour.
This can be avoided by adding the LLDB commands into separate project-related files and using command source <filename> within the ~/.lldbinit file to load all LLDB commands within that file. There is an LLDB plugin available called Trampoline which uses the above mechanism and automatically loads custom lldb init files depending on the current target architecture and binary name.
Conclusion
LLDB is a very versatile tool during development and can do a lot more than just adding breakpoints and stopping execution when they are hit. The article did only cover a small amount of the capabilities of LLDB, others being:
- Reading and writing memory
- Finding patterns in memory
- Dumping complete memory sections
- Reading and writing register values
- Reloading libraries during execution
- Developing custom plugins in C++/Python
- Watchpoints to observe access to memory areas
- Disassembling the current binary
and many more.
Use help to see a comprehensive list of all available commands and aliases. To drill into the subcommands of each command use help <command>.
Read on
Are you looking for support in your app development process? Have a look at our offerings!


